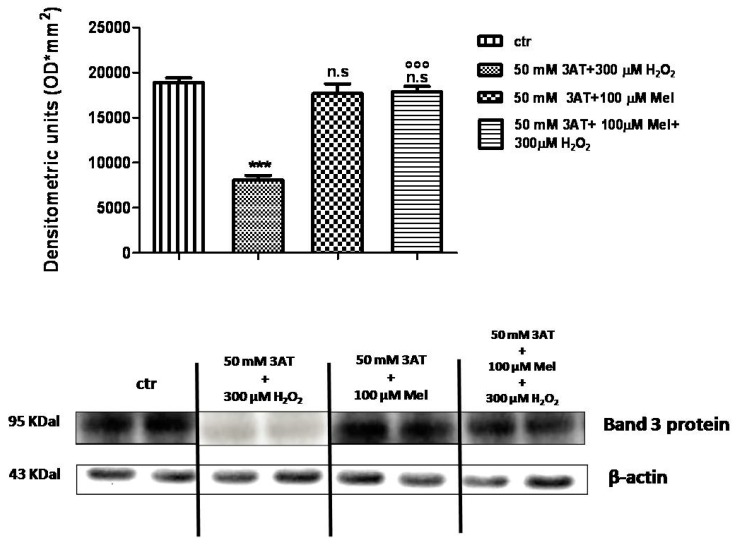
Figure 11.
Expression levels of Band 3 protein measured in untreated erythrocytes (ctr), or in 50 mM 3-AT + 300 µM H2O2- or in 50 mM 3-AT + 100 µM Mel or in 50 mM 3-AT + 100 µM Mel + 300 µM H2O2-treated erythrocytes, detected by Western blot analysis. *** p < 0.001 vs. ctr; n.s. not significant vs. ctr; °°° p < 0.001 vs. 50 mM 3-AT + 300 µM H2O2, as determined by one way ANOVA followed by Bonferroni’s post hoc test (N = 5).

