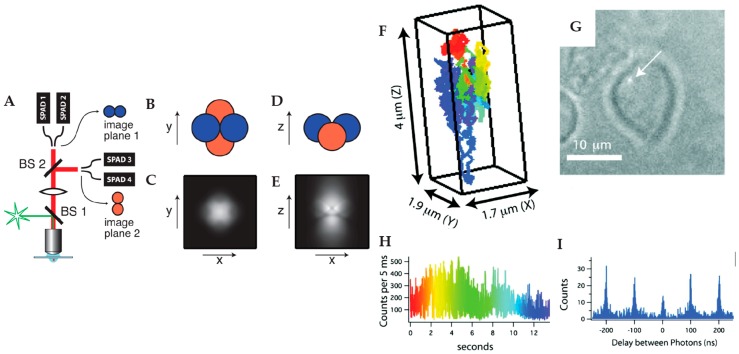
Figure 4.
Tetrahedral detection active feedback 3D tracking. (A) Schematic of experimental setup. BS: beamsplitter; SPAD: single-photon counting avalanche photodiode. (B,D) Schematic of the sample volume viewed along Z (B) and Y (D) axis, in which the four balls represent the sample volumes of four SPC-APDs. (C,E) Total fluorescent intensity in the Z = 0 plane (C) and Y = 0 plane (E). Reprinted from reference [67], with the permission of AIP Publishing. (F) 3D trajectory of a single quantum dot labeled high-affinity immunoglobin E receptor (IgE-FcεR) in a live cell. The rainbow color from red to blue indicates time. (G) Image of cell and the actively tracked receptor (white arrow). (H) Fluorescence intensity of the quantum dot probe as a function of time. (I) Photon pair correlation measurement shows fluorescence photon antibunching, indicating a single quantum emitter. Reprinted with permission from reference [70]. Copyright 2010 American Chemical Society.

