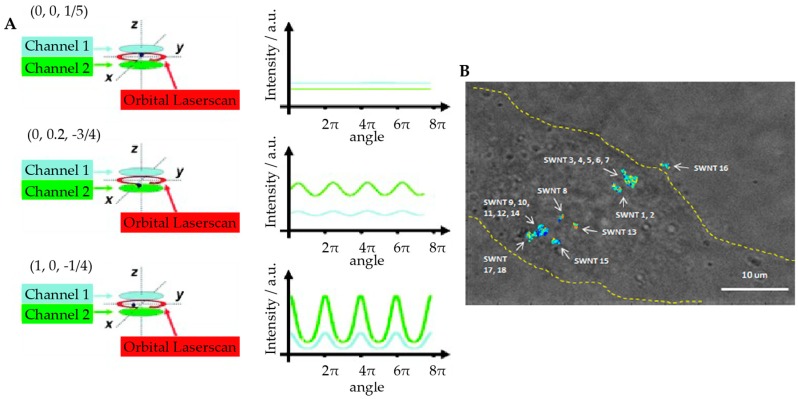
Figure 7.
Orbital tracking with biplane detection. (A) Schematic of particle position measurement. The laser focus is scanned in a circle around the tracked particle while the two detection channels monitor the intensity at two axial planes (right panel). The X and Y positions of the particle are calculated from the modulation amplitude and phase of the fluorescence signal. The Z position is calculated by the difference of the signal between the two detection channels. Reprinted from reference [84]. Copyright 2009 Wiley-VCH. (B) 3D orbital tracking of single-walled carbon nanotubes (SWNT) in live cells. The image shows overlaid bright field image of Hela cell (outlined in yellow) with 18 SWNT trajectories. Adapted from reference [85]. Copyright 2012 American Chemical Society.

