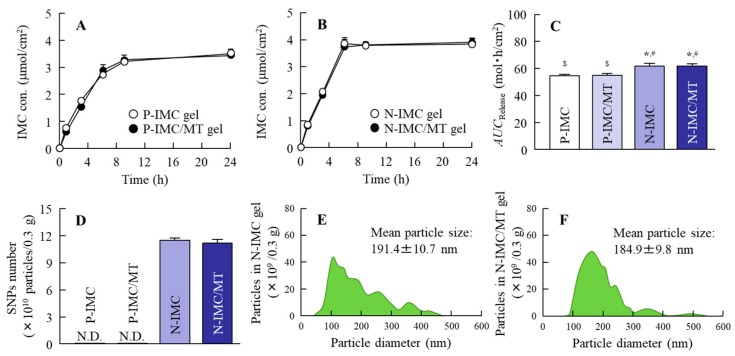
Figure 4.
IMC release from the transdermal formulations through 20 µm pore membranes. (A); the drug release from the P-IMC and P-IMC/MT gels through the membranes. (B); the drug release from the N-IMC and N-IMC/MT gels through the membranes. (C); the area under the IMC concentration-time curve of drug release (AUCRelease) for the IMC transdermal formulations. (D); the number of IMC SNPs released from the transdermal formulations 24 h after application. (E) and (F); the size frequencies of IMC released from the N-IMC (E) and N-IMC/MT (F) gels 24 h after application. These samples were collected in the reservoir chamber. n = 7. * p < 0.05 vs. P-IMC gel for each category. # p < 0.05 vs. P-IMC/MT gel for each category. $ p < 0.05 vs. N-IMC gel for each category. The combination with l-menthol did not affect drug release from the IMC transdermal formulations, and the IMC released from the N-IMC and N-IMC/MT gels was in the SNPs state (mean particle size, N-IMC gel 191.4 nm, N-IMC/MT gel 184.9 nm).

