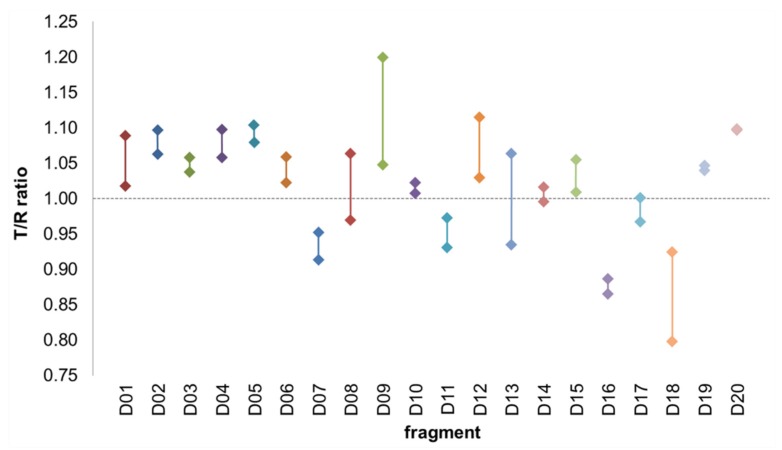
Figure 4.
Sensitivity and reproducibility. As quality control, twenty fragments were run in duplicate. The median difference between two measurements was 0.04 and the average difference was 0.05. This shows that the sensitivity of the method is high enough to justify the chosen cutoff of T/R ≤ 0.85. Sixteen out of these twenty fragments had the same outcome, favoring either FtsQp (T/R < 1.00) or the reference protein (T/R > 1.00) in both experiments. Two fragments had a different outcome but a very small mutual difference < 0.05 close to T/R = 1 (D14 and D17), and two fragments did have a different outcome due to a mutual difference > 0.05 (D13 and D08).

