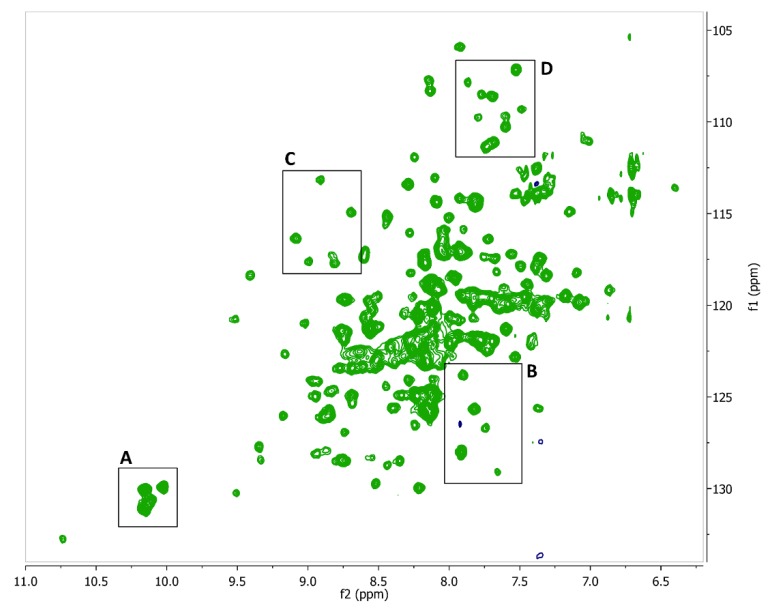
Figure 5.
1H-15N HSQC spectrum of the periplasmic domain of FtsQ. The five tryptophan residues give clear distinguishable signals at a 10–11 ppm shift. Area’s (A–D) show the portions of the spectrum from which the zooms showing chemical shifts perturbations were taken, as shown in Figure 6.

