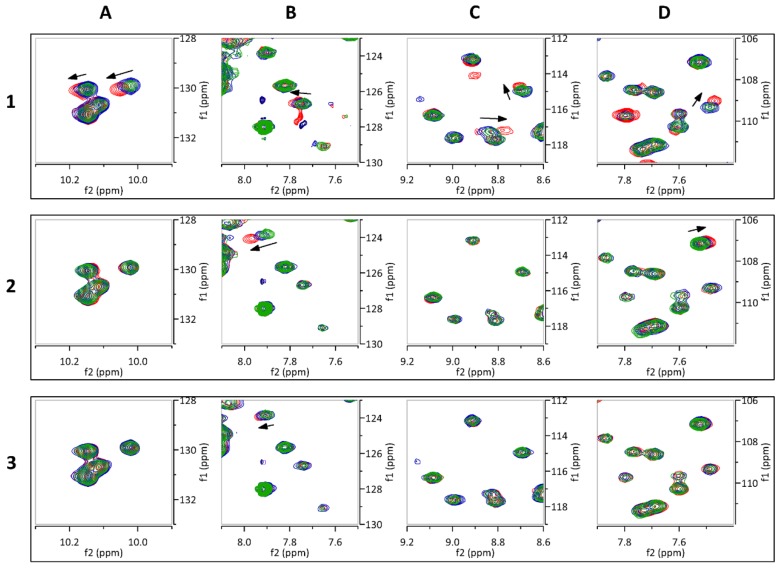
Figure 6.
Chemical shift perturbations of FtsQp with compounds 1, 2 and 3. Each panel shows the superimposed spectra of 200 µM FtsQp without the fragment (green) and in solution with the fragment at 1 mM (blue), and 4 mM (red). Chemical shift perturbations are marked by black arrows. The areas of the close-ups shown in panels (A–D) are designated in Figure 5.

