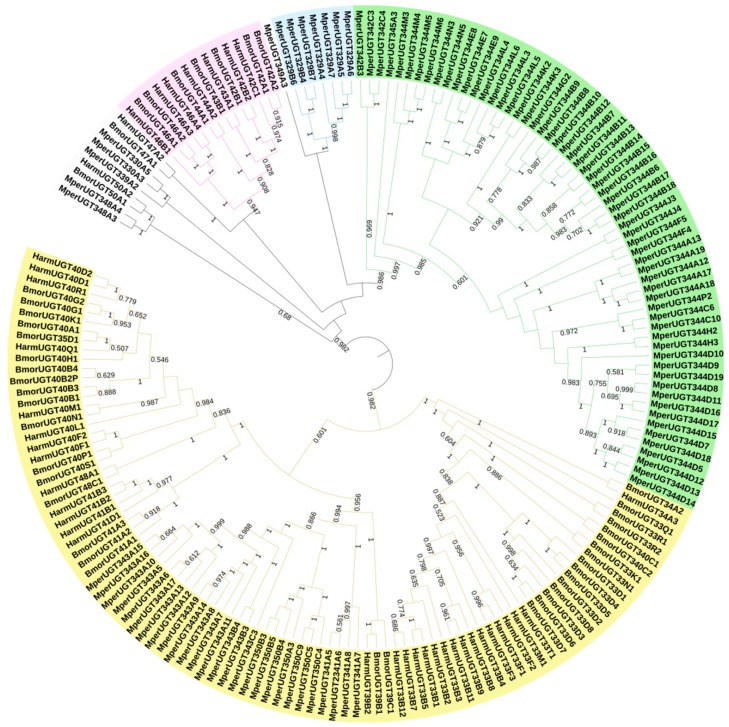
Figure 2.
Phylogenetic analysis of M. persicae UGT genes and orthologs in H. armigera and B. mori. A phylogram was generated using the maximum likelihood method in MEGA7, and bootstrap values were computed based on 1000 replicates with a cutoff of <50%. The sequences used for constructing the tree are listed in Supplementary Data 1 and Supplementary Data 2.

