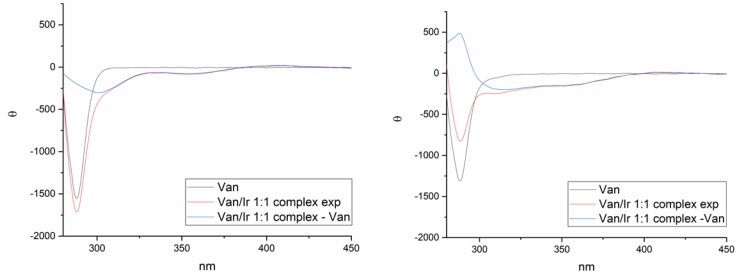
Figure 1.
Circular dichroism (CD) spectra of free Vancomycin (Van) (black line) and Van/Ir 1:1 complex (red line) recorded in acetate buffer (pH 5, on the left) and in phosphate buffer (pH 8, on the right) are reported. The blue line is the obtained spectrum by subtracting Van contribution from the 1:1 complex. The concentration of Ir(III) is 2.5 mM.

