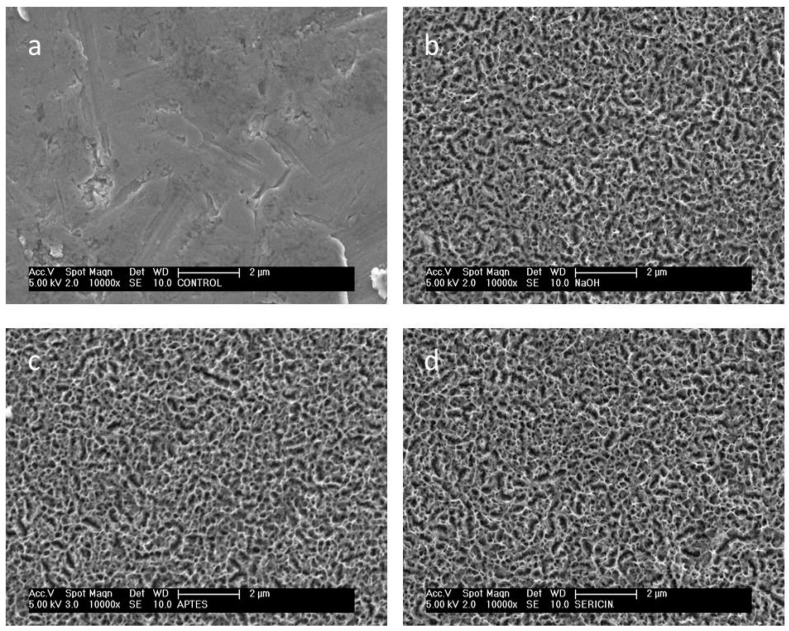
Figure 2.
Micromorphology of the disk surface at different production step: (a) untreated control, (b) after etching (NaOH), (c) after etching and silanization (NaOH + VapAPTES), (d) after etching, silanization and sericin bioconjugation with glutaraldehyde (NaOH + VapAPTES + GLU). Images (c,d) are representative also for the micromorphology of disks subjected to the alternative silanization (SolAPTES) and bioconjugation (EDC/NHS) processes respectively. Scanning electron microscopy, secondary electrons detector signal, original magnification 10,000×.

