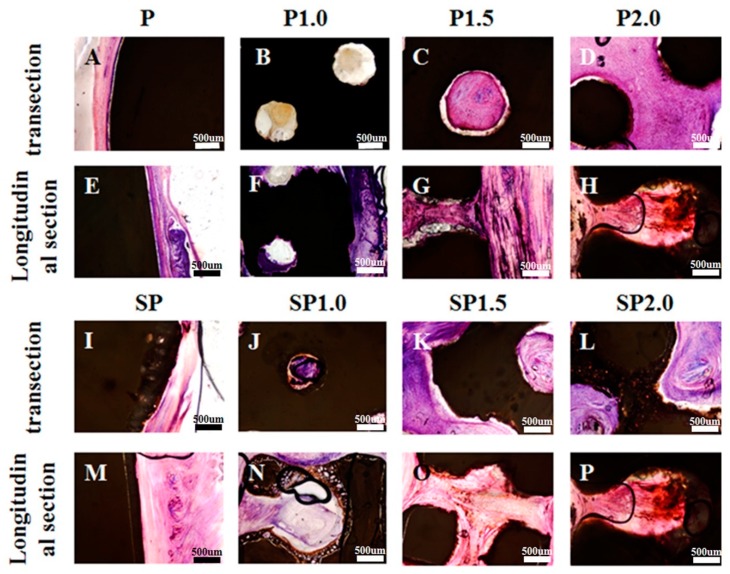
Figure 6.
Hematoxylin and eosin (HE) staining images of different transplanted peek specimens after 4 weeks. (A) Transection HE staining images of group (A) P, (B) P1.0, (C) P1.5, (D) P2.0, (I) SP, (J) SP1.0, (K) SP1.5, and (L) SP2.0 with soft tissue. Longitudinal sections of HE staining images of group (E) P, (F) P1.0, (G) P1.5, and (H) P2.0, (M) SP, (N) SP1.0, (O) SP1.5, and (P) SP2.0 with soft tissue.

