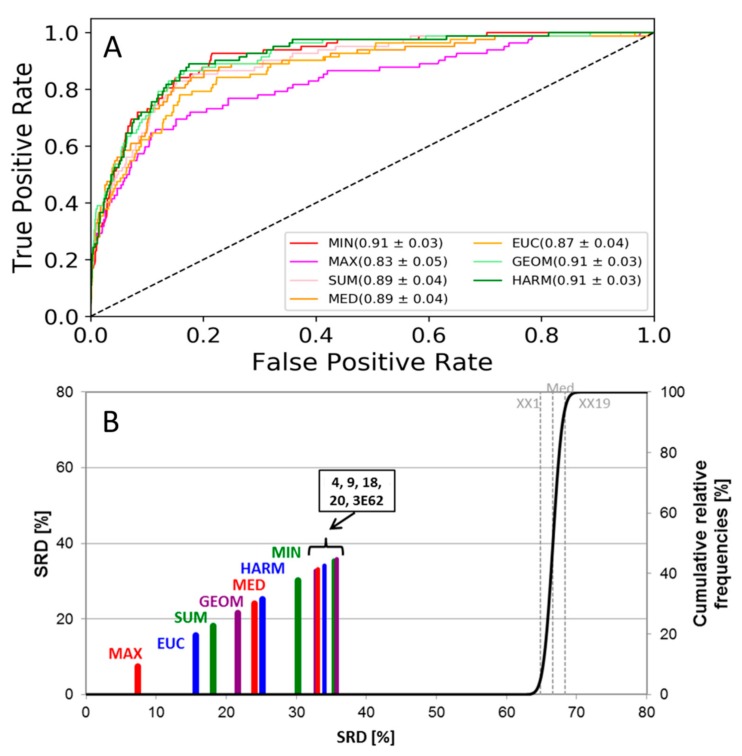
Figure 2.
(A) ROC curves of the JAK2 dataset. The AUC values and standard deviations for each fusion rule are included in the legend. Single-structure docking scores are omitted for clarity. (B) SRD analysis of the JAK2 dataset. Normalized SRD values are plotted on the x and left y axes, and the cumulative relative frequencies of SRD values for random ranking are plotted on the right y axis and shown as the black curve. Single-structure docking scores are labeled based on PDB code (3E62) or sequential MD frame number (4, 9, 18, 20).

