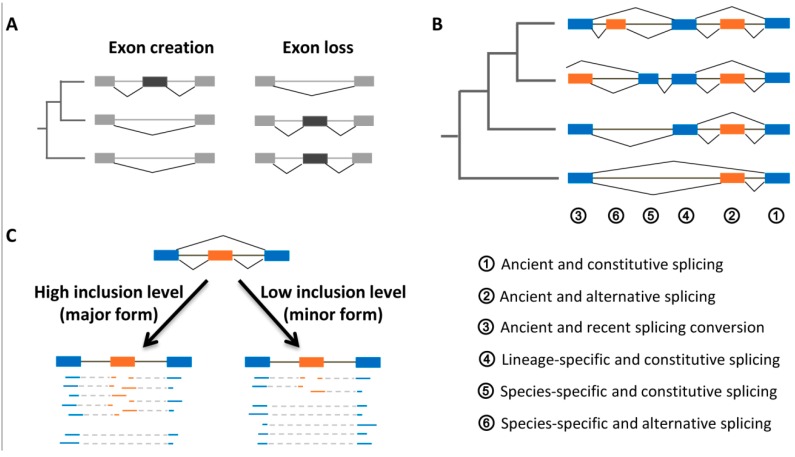
Figure 3.
Exon evolutionary ages and inclusion levels. (A) Exon creation as well as loss is first illustrated within an evolutionary tree of three species. Subsequently, six exons are schematically exemplified to show the different evolutionary ages and splicing patterns (B). The inclusion levels of one alternative exon are detected by the spliced mapping of RNA-Seq reads against reference genome (C).

