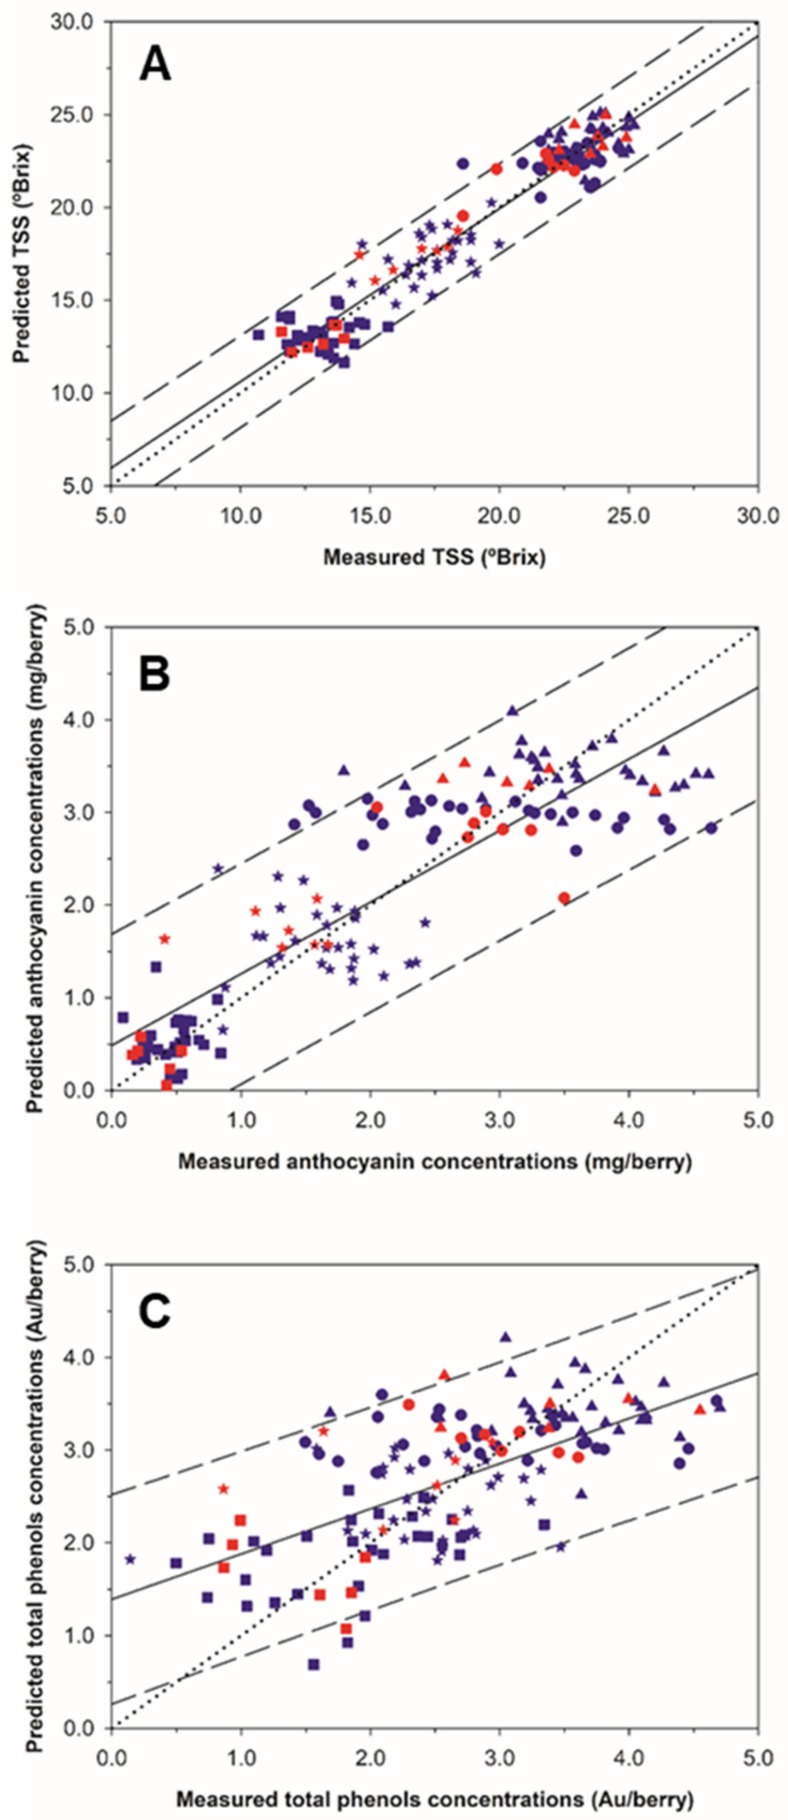
Figure 2.
Regression plots for the total soluble solids (A), anthocyanins (B) and total polyphenols (C) using the best Partial Least Squares (PLS) models generated from on-the-go grape clusters spectral measurements. (blue color) 10-fold cross validation; (red color) external validation. (■: 11 August; *: 24 August; ●: 18 September; ▲: 28 September). Solid line represents the regression line and dotted line refers to the 1:1 line. Prediction confidence bands are shown at a 95% level (dashed lines).

