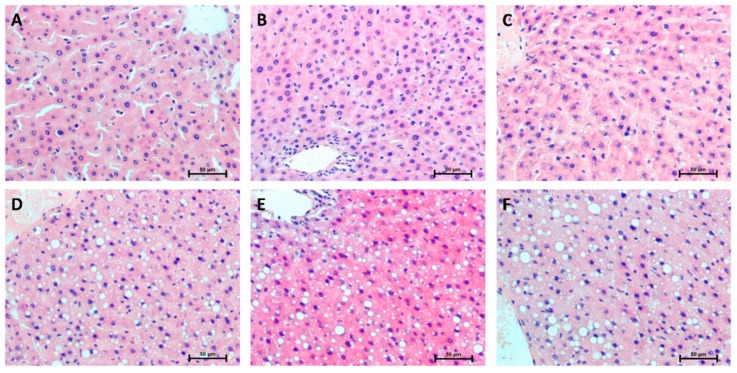
Figure 8.
Representative histological images showing hematoxylin–eosin (H + E) staining of the liver from control group (0 week, A) and HFD group at the end of the first (B), second (C), third (D), fourth (E) and fifth (F) experimental week. The data are based on six independent determinations (n = 6) of the same fragment of the lobe from each rat. Original magnification of 200× and the length of the calibration bar is 50 µm.

