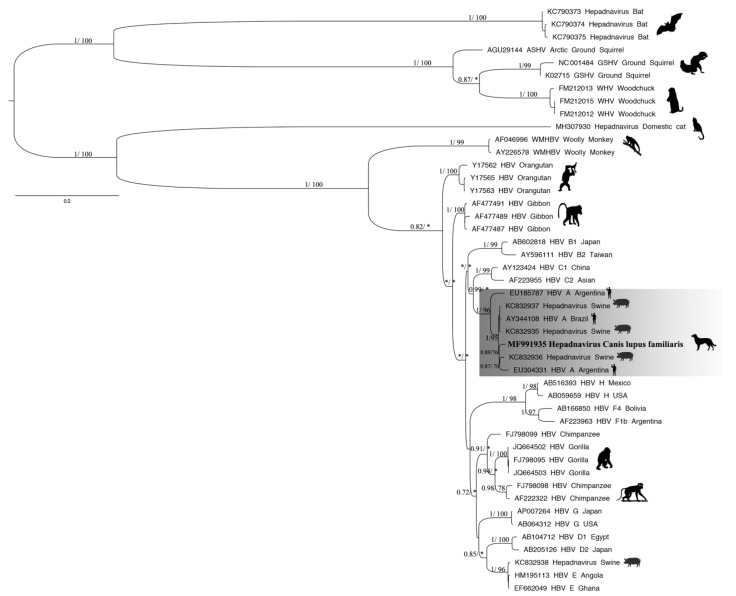
Figure 3.
Phylogenetic relations based on the fragment of the pre-S/S gene of hepadnaviruses (1125 nt) using maximum likelihood (ML) and Bayesian methods. For each sequence used, the GenBank accession number and host are shown. The tree was rooted at the midpoint. Numbers (≥0.7/≥70) above the branches indicate node probabilities or bootstrap values (MrBayes/ML). Asterisks indicate values below 0.7/70. The sequences of this study are highlighted in bold. The scale bar indicates the evolutionary distance.

