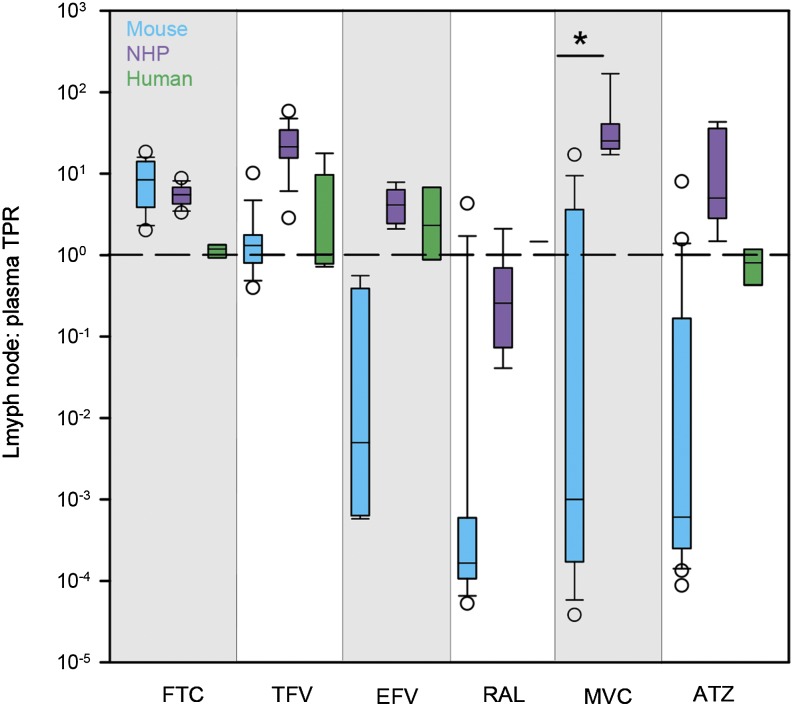
Fig. 2.
Cross-species differences in ARV TPRs in mice (blue boxes), NHPs (purple boxes), and humans (green boxes). Boxes are the 25th percentile, median, and 75th percentile. Whiskers are the fifth and 95th percentiles, and dots are outliers. The dashed line indicates equal drug concentrations in lymph node and plasma. Sample sizes for each drug in each species are given in Supplemental Table 2. Between-species differences were analyzed using Kruskal–Wallis one-way ANOVA with Dunn’s method correction for multiple comparisons. *P < 0.05.

