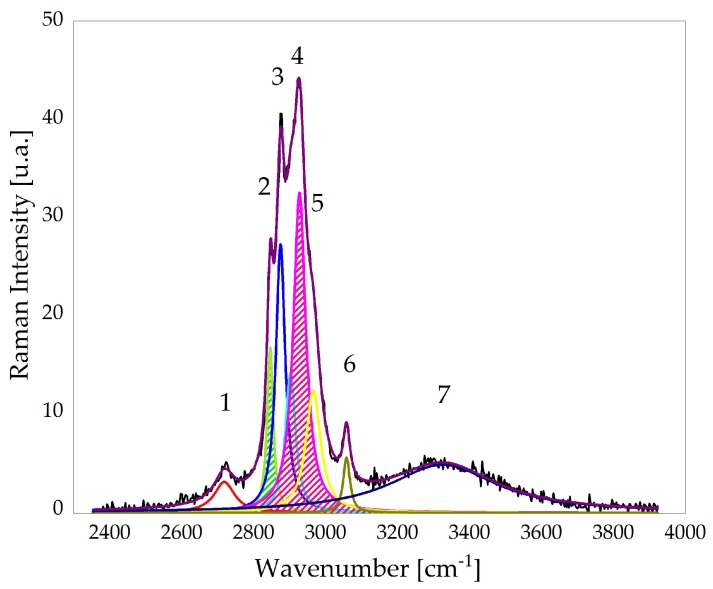
Figure 5.
Deconvolution of the typical Raman spectrum of the fern region. The multiple peak fitting was performed in the spectral region 2300–3900 cm by using seven Lorentzian functions. Green and pink curves correspond to the Raman peaks associated to lipids and proteins, respectively, used to evaluate the ratio R defined in the text.

