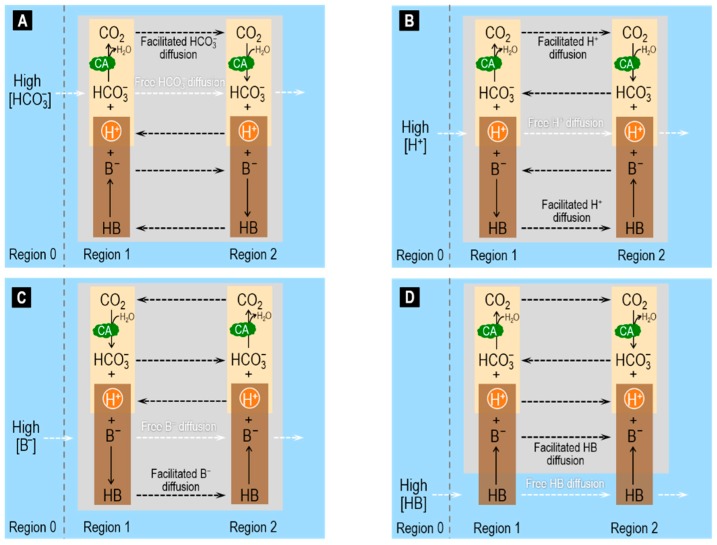
Figure 2.
Schematic of the reaction and diffusion processes involved in facilitated diffusion of: HCO3− (A); H+ (B); B− (C); and HB (D). We set up the four examples as in Figure 1, except that the component that we add to Region 0 is different. At time zero, we establish a gradient for HCO3− in (A) from Region 0 (high [HCO3−]) to Region 1 (low [HCO3−]), for H+ in (B), for B− in (C), and for HB in (D). The solid arrows identify reactions, and the dashed arrows identify free solute diffusion. For details, see text. CA, carbonic anhydrase.

