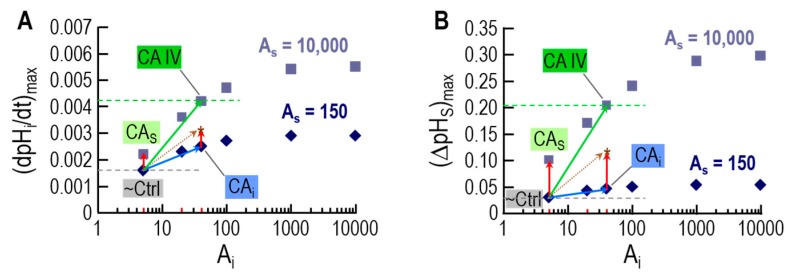
Figure 6.
Supra-additive effects of intracellular and extracellular-surface CA activities on kinetics of pH changes, as predicted by mathematical modeling. The insets to Figure 4 show the protocol of the physiological experiment: the addition of CO2/HCO3− to the extracellular fluid causes: (a) a quasi-exponential decrease of intracellular pH (pHi); and (b) a rapid increase in the pH at the extracellular surface (pHS), followed by a quasi-exponential decay. (A) The maximal rate of the pHi decrease—(dpHi/dt)max—for 12 simulations, 6 varying the intracellular CA acceleration factor (Ai) at a fixed extracellular-surface CA acceleration factor (AS) of 150 (diamonds), and 6 varying Ai at a fixed AS of 10,000 (squares). (B) The maximal shift in pHS—(ΔpHS)max—for the same 12 simulations in (A). Each of the 12 simulations models a hypothetical oocyte exposed to a bulk solution containing 1.5% CO2/10 mM HCO3− at pH 7.50. (A) Dependence of (dpHi/dt)max on Ai, for each of the two different values of AS. (B) Dependence of (ΔpHS)max on Ai, for each of the two different values of AS. In each panel, the six diamonds represent an isopleth for AS = 150, whereas the six squares represent an isopleth for AS = 10,000. In each panel, the diamond labeled “~Ctrl” (i.e., Ai = 5, AS = 150) represents a “control” oocyte that is, an oocyte not expressing or injected with any heterologous protein. For “~Ctrl”, the (dpHi/dt)max value in (A) and the (ΔpHS)max value in (B) approximately match the mean data for physiological experiments, indicated by the horizontal dashed gray lines. In each panel, the square labeled “CA IV” (i.e., Ai = 40, AS = 10,000) represents an oocyte expressing CA IV, with (dpHi/dt)max and (ΔpHS)max values approximately matching the mean data for physiological experiments, indicated by the horizontal dashed green lines. In each panel, the square labeled “CAS” (i.e., Ai = 5, AS = 10,000) represents a hypothetical oocyte that—compared to “~Ctrl”—has an isolated increase in AS. Note that the (dpHi/dt)max and (ΔpHS)max values for this hypothetical “CAS” increase by amounts (red vector) that are far smaller than those actually observed for real oocytes expressing CA IV (i.e., vertical distances between horizontal dashed green and grey lines). The only way for the simulations to explain the physiological data is if CA IV expression not only raises AS from 150 to 10,000 but also raises Ai from 5 to 40 (green vector). Indeed, physiological evidence indicates that Ai must indeed increase. In each panel, the diamond labeled “CAi” (i.e., Ai = 40, AS = 150) represents a hypothetical oocyte with a cytosolic CA activity that is the same as that postulated for an oocyte actually expressing CA IV (blue vector). The sum of the red vector (increase AS only) and the blue vector (increase Ai only) is the point labeled “*” (dashed golden vector). Notice that the green vector predicts that CA IV expression (combined increases in AS and Ai) produces much larger increases in (dpHi/dt)max and (ΔpHS)max than the dashed golden vector (the sum of isolated increases in AS and Ai). In other words, the effects of simultaneously increasing AS and Ai are supra-additive. Modified from Figure 13 in [79].

