Figure 4.
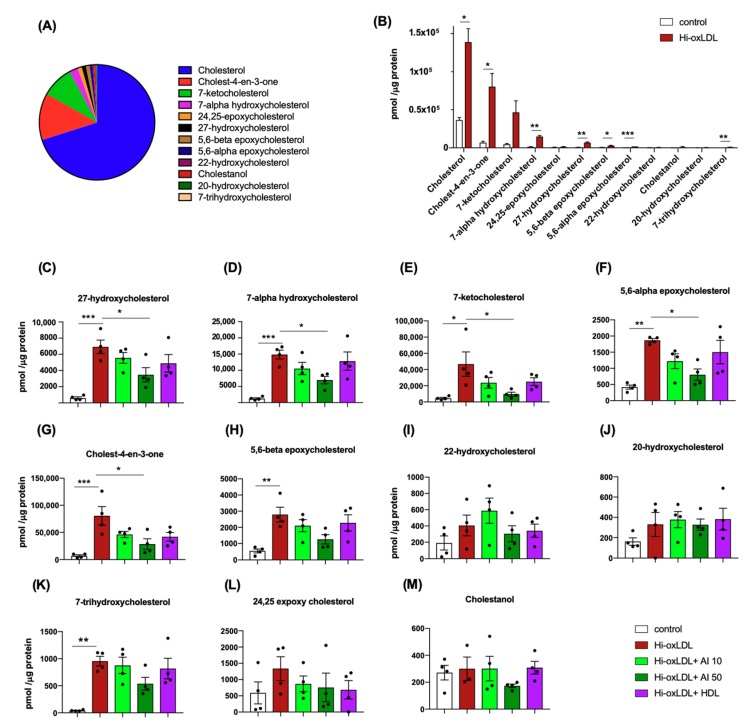
Targeted sterol lipidomics. (A) Relative levels of 12 sterols were presented based on their % of abundance to total sterols detected in untreated MPMs. (B) Increased levels of oxysterols upon hi-oxLDL loading were presented as abundance (C–M) Abundance of individual sterol species with apoA-I and HDL treatments. The abundance of lipids in (B–M) was calculated by pmol of lipid normalized to μg of protein. The data were presented as mean ± SEM (n = 4 per group). * p < 0.05, ** p < 0.05, *** p < 0.0005.

