Figure 1.
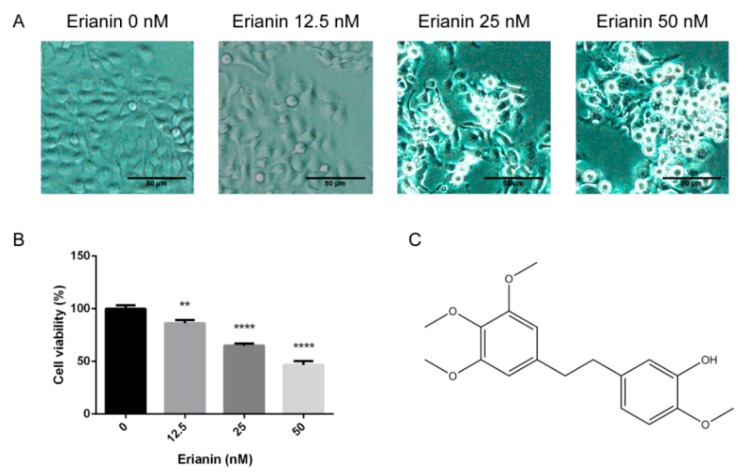
Effects of erianin on the morphology and viability of a human keratinocyte cell line (HaCaT). Cells were treated with various concentrations of erianin (12.5 nM, 25 nM and 50 nM) for 24 h. (A) Microscopy images of cellular morphology. Scale bar = 50 μm. (B) Cell viability was detected by the MTT assay. (C) The chemical structure of erianin. The values are expressed as means ± standard deviation (SD) (n = 3). ** p < 0.01, **** p < 0.001, significantly different compared with the untreated group.

