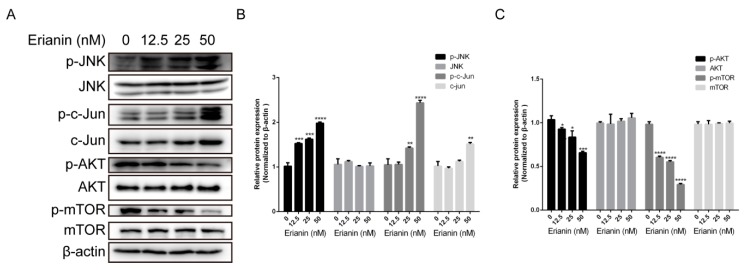
Figure 4.
Erianin-activated JNK/c-Jun signaling pathway and erianin-inactivated AKT/mTOR signaling pathway in HaCaT cells. Cells were treated with various concentrations of erianin (12.5 nM, 25 nM and 50 nM) for 24 h. (A) Western blots for JNK/c-Jun and AKT/mTOR signal pathway. (B), (C) The relative expression intensity of each protein was normalized to the internal control β-actin. The values are expressed as mean ± SD (n = 3). * p < 0.05, ** p < 0.01, *** p < 0.005, **** p < 0.001, significantly different compared with the untreated group.

