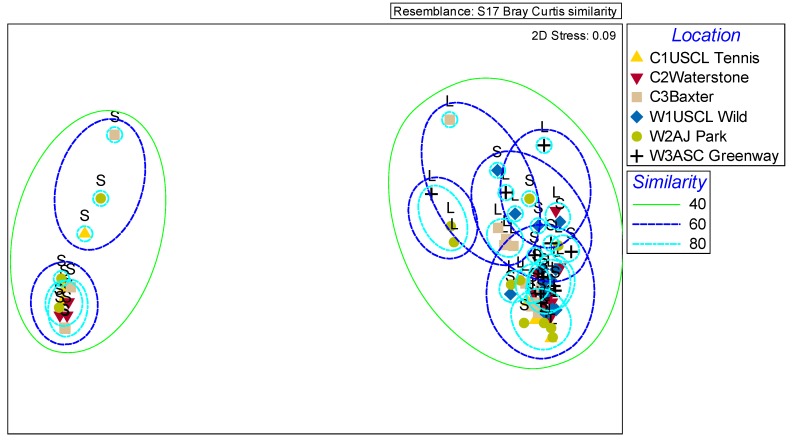
Figure 4.
Non-metric multidimensional scaling plot of the relative proportions of all floral volatiles emitted by L and S flowered morphs based on the Bray-Curtis dissimilarity index (stress = 0.09). Population locations are indicated by different symbols. The lines around the two groups indicate similarity percentages based on cluster analysis comparing the overall scent profiles.

