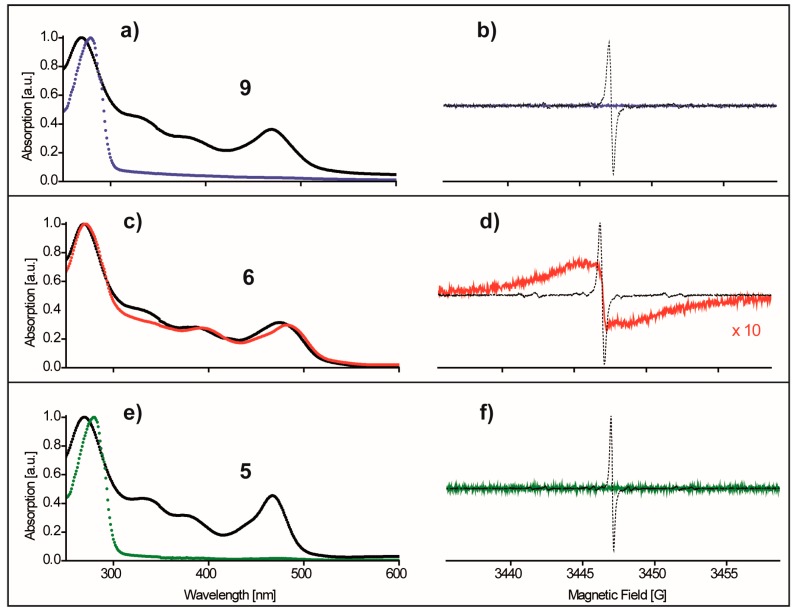
Figure 4.
The incubations of 9 (blue), 6 (red) and 5 (green) with cysteine-free YopO-WT. The spectra shown have been recorded after size exclusion chromatography. Panels (a,c,e): normalized UV/Vis spectra of the protein solutions in juxtaposition with 20 µM buffer solutions of the pure trityl compounds 9, 6, and 5 (black). Panels (b,d,f): corresponding room temperature cw X-band EPR spectra overlaid with the spectrum of the free label (dashed black line) for the sake of comparison.

