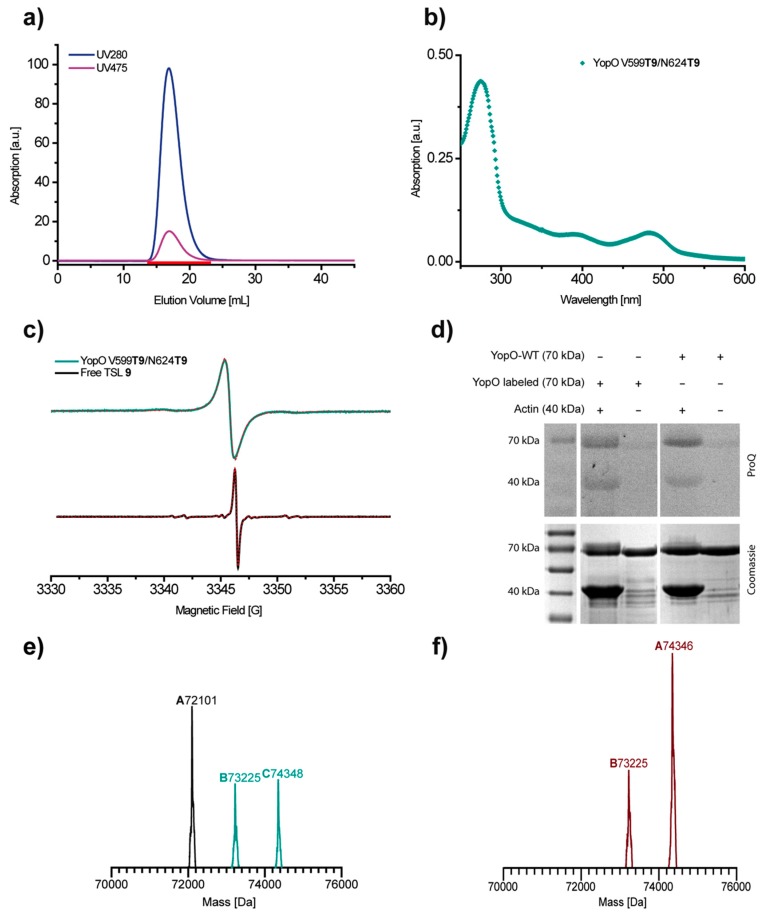
Figure 6.
The labeling of YopO V599C/N624C with 9. The analytics after the separation of the free label via PD-10 column. (a) HiPrep 26/10 size exclusion chromatogram of the labeled protein showing the trityl specific absorption at ~475 nm (red) and the absorption at 280 nm (blue). (b) UV/Vis spectrum of the labeled protein. The absorption maxima at ~475 nm and at ~280 nm are calculated to represent a concentration ratio of 9 to YopO of 1.8/1, i.e., 90% labeling efficiency. (c) The room temperature X-band cw EPR spectrum of the labeled protein YopO V599T9/N624T9 (mint) as compared to the free label (black). The dashed red lines indicate spectral simulations obtained with EasySpin (Supplementary Materials, Section 8.2) [76]. EMXmicro acquisition parameters: modulation amplitude 0.15 G, microwave power 2.783 mW, time constant 20.48 ms, sweep time 42.04 s, resolution 67 pts/G. (d) The phosphorylation assay of labeled YopO V599T9/N624T9 in comparison to YopO-WT. The phosphorylation is detected using ProQ Diamond stain and subsequent Coomassie staining. (e) ESI(+)-MS of the intact protein YopO V599T9/N624T9. The doubly labeled protein calculated: 74,347.6 Da, found: 74,348 Da (peak C). (f) ESI(+)-MS of the intact protein YopO S585T9/Q603T9. The doubly labeled protein calculated: 74,345.6 Da, found: 74,346 Da (peak A).

