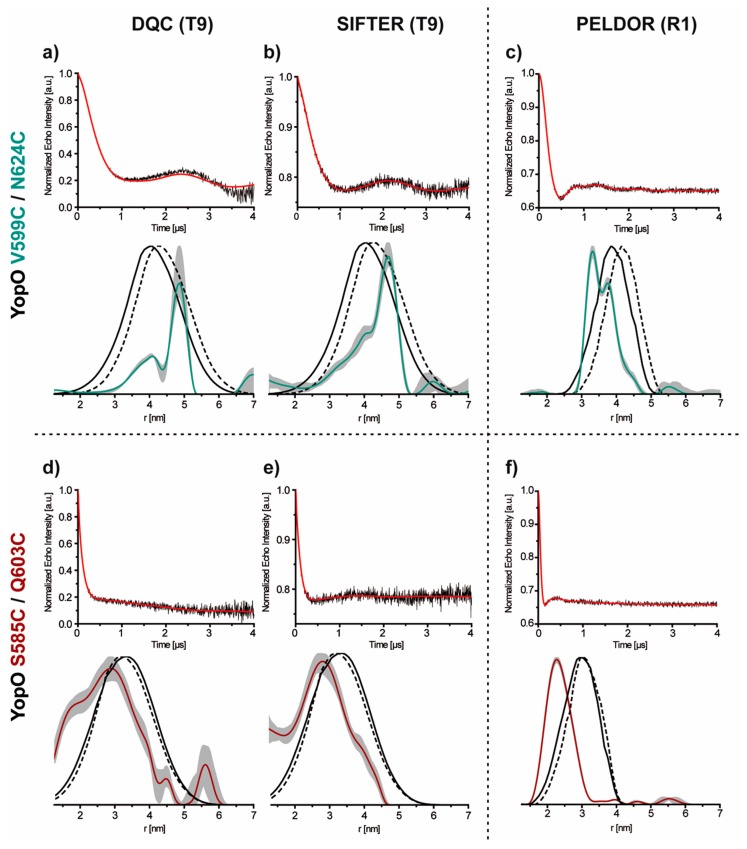
Figure 7.
The PDS data of YopO V599C/N624C and S585C/Q603C. On the left, the background corrected DQC (a,d) and SIFTER (b,e) time traces (top) and their corresponding distance distributions (bottom) for YopO V599T9/N624T9 and S585T9/Q603T9. On the right, the PELDOR (c,f) time traces (top) and the corresponding distance distributions (below) for YopO V599R1/N624R1 (mint) and S585R1/Q603R1 (red). In each case, the background corrected PDS time traces are shown in black, the corresponding fits from Tikhonov regularization in red. The distance distributions are shown in the respective color code while shaded grey areas indicate the error margins as obtained by the validation routine of DeerAnalysis [78]. The in silico predictions of the distance distributions were generated with mtsslWizard [75] and overlaid as dashed (PDB-ID 4ci6) and solid (PDB-ID 2h7o) black lines.

