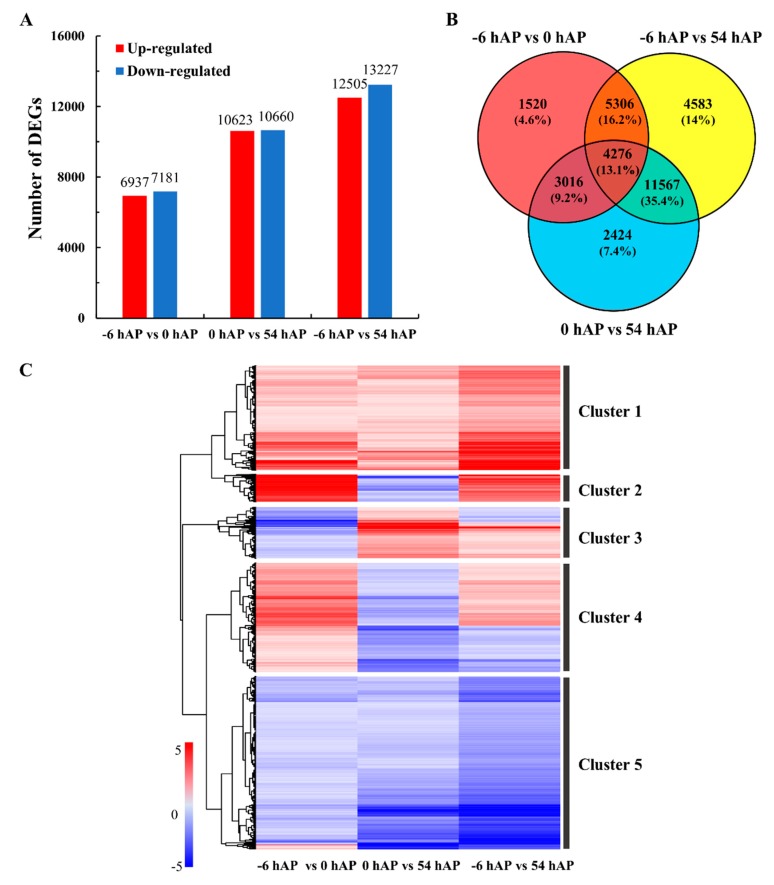
Figure 2.
Differentially expressed genes (DEGs) from RNA-seq during the early phases of AR formation in mulberry stem hardwood cuttings. The number of DEGs in the three time point comparison groups (−6 hAP vs. 0 hAP, 0 hAP vs. 54 hAP, −6 hAP vs. 54 hAP) (A), the Venn diagram presentation of the overlapped DEGs (B), and the hierarchical clustering analysis of the 4276 common DEGs based on data of log2Ratio for each gene (C), are presented. The common genes are divided into five clusters. The color bar, ranging from blue to red, indicates low to high changes of transcriptional expression level from −5 to 5.

