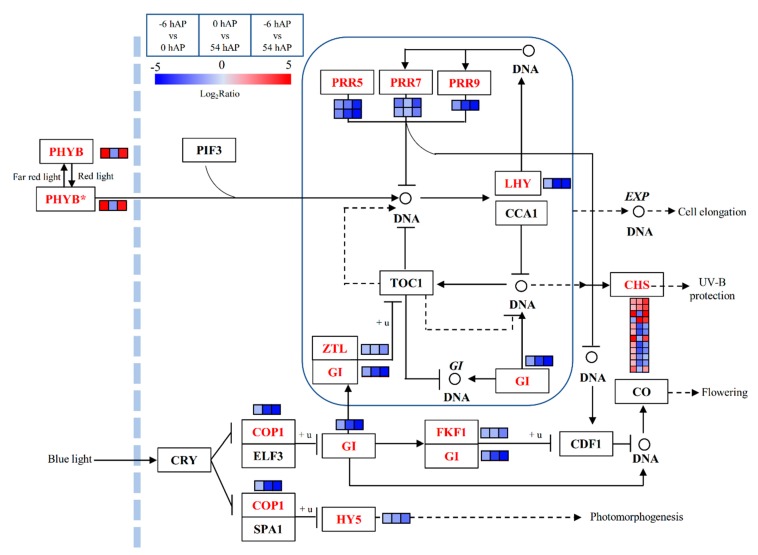
Figure 4.
The significantly expressed common genes involved in the circadian rhythm plant pathway during the early phases of AR formation in mulberry stem hardwood cuttings. The enriched common genes are in red, and the changes of transcriptional expression levels in the three comparison groups are illustrated with colored boxes. The boxes from the left to right indicate −6 hAP vs. 0 hAP, 0 hAP vs. 54 hAP, and −6 hAP vs. 54 hAP, respectively. Each row of boxes represents a mulberry homolog gene. The color code from blue to red represents the changes of transcriptional expression level between –5 and 5. The solid or dashed arrows indicate direct or indirect positive effects, and the T type lines indicate inhibitory effects. This figure is redrawn based on the KEGG pathways.

