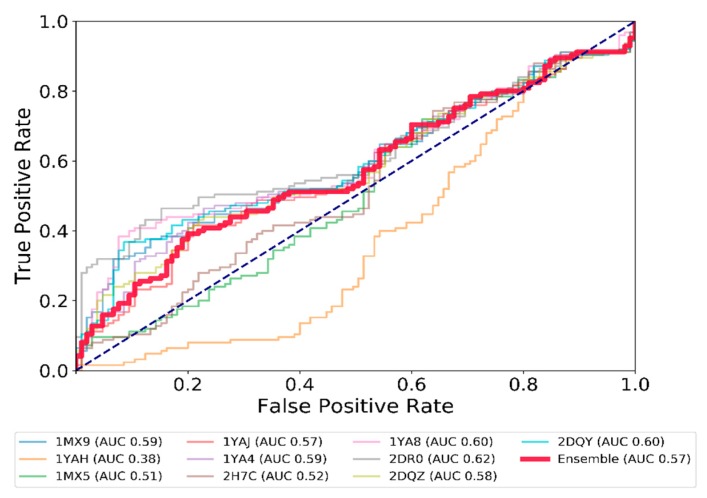
Figure 2.
ROC curves showing the performance of docking based on the average energy score for each CES1 ligand docked in the 10 CES1 conformations. Each line corresponds to the results of the correct ranking of active ligands (with an activity below 10 µM) on one X-ray structure of CES1. The red line (Ensemble) considers the average energy score attributed to a ligand across every X-ray structure used in the docking protocol. The dashed line represents a random ranking.

