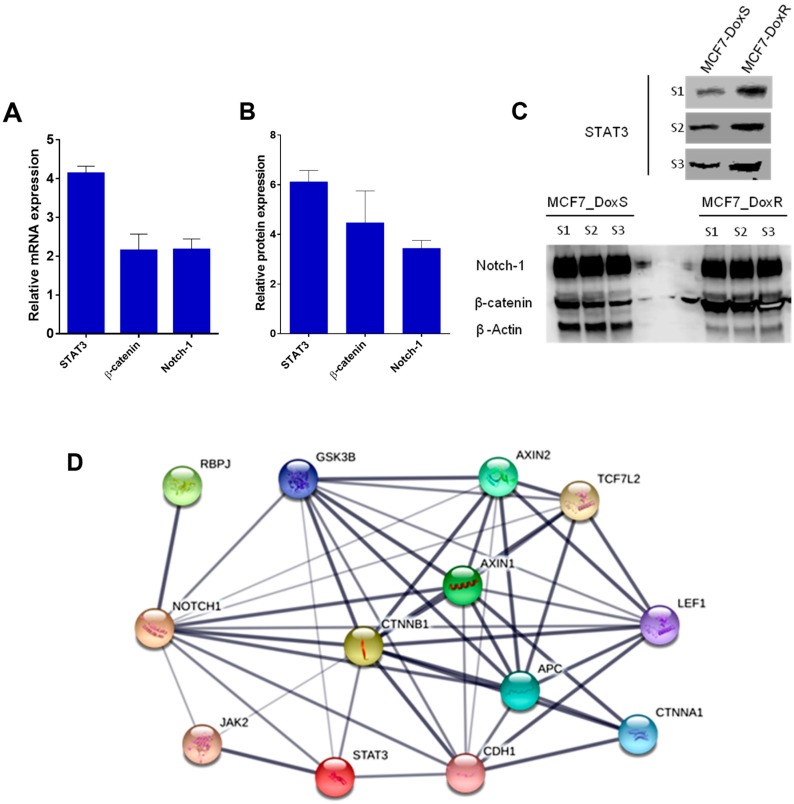
Figure 3.
Expression of targeted genes. (A) The fold change in the mRNA expression of STAT3, β-catenin, and Notch-1 in MCF7_DoxR cells compared to the MCF7_DoxS cells (the 18srRNA gene was used as a housekeeping gene for Q-PCR). (B) The fold change in the protein expression of STAT3, β-catenin, and Notch-1 in MCF7_DoxR cells compared to the MCF7_DoxS cells. (C) The expression of STAT3, β-catenin, and Notch-1 proteins analyzed by WB (S1, S2, and S3 stands for three different samples). (D) STRING analysis of protein–protein interactions of the STAT3, β-catenin, and Notch-1 proteins, upregulated in MCF7_DoxR cells compared with MCF7_DoxS cells (thickness of edges indicates confidence) [39]. Data represent the average of three independent experiments ± SD.

