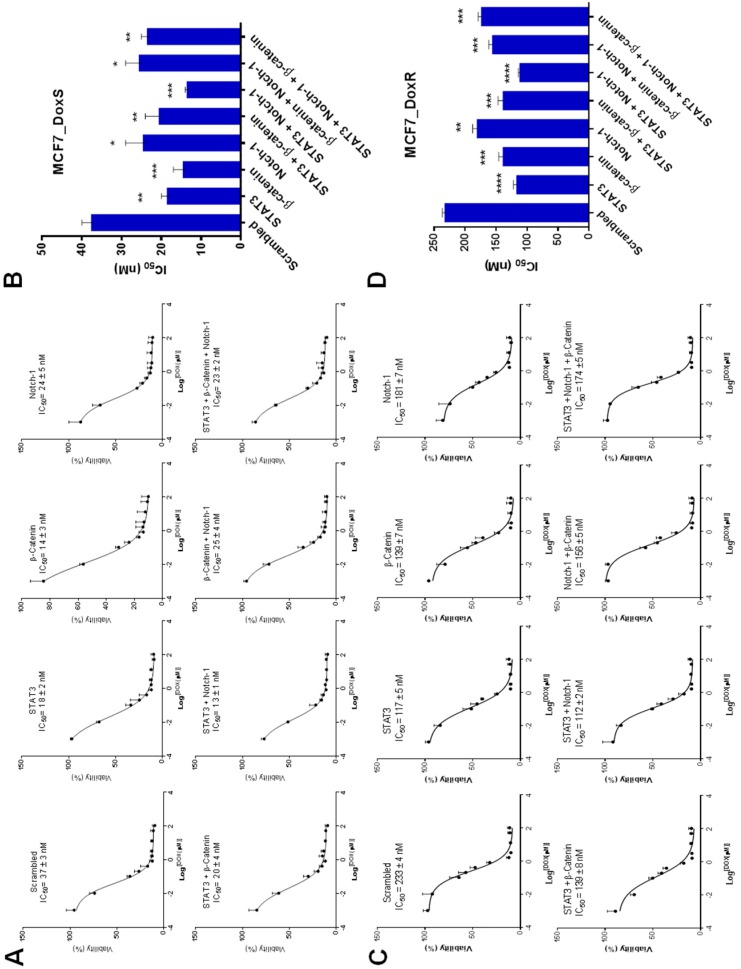
Figure 7.
IC50 values after siRNA and doxorubicin treatment. Both MCF7_DoxS and MCF7_DoxR cells were treated with a fixed concentration of siRNA (50 nM) and different concentrations of doxorubicin for 72 h to assess the effect of siRNA and doxorubicin combinations on cell viability using the MTT assay. (A) The dose–response curves and (B) the IC50 values of doxorubicin combined with single and combinations of siRNA in MCF7_DoxS. (C) The dose–response curves and (D) the IC50 values of doxorubicin combined with single and combinations of siRNA in MCF7_DoxR. Scrambled siRNA was used as the negative control for comparison. All IC50 values represent the average of three independent experiments with four replicates per siRNA concentration for each experiment. Statistical significance: Student’s t test, * indicates p < 0.05, ** indicates p < 0.01, *** indicates p < 0.001, **** indicates p < 0.0001.

