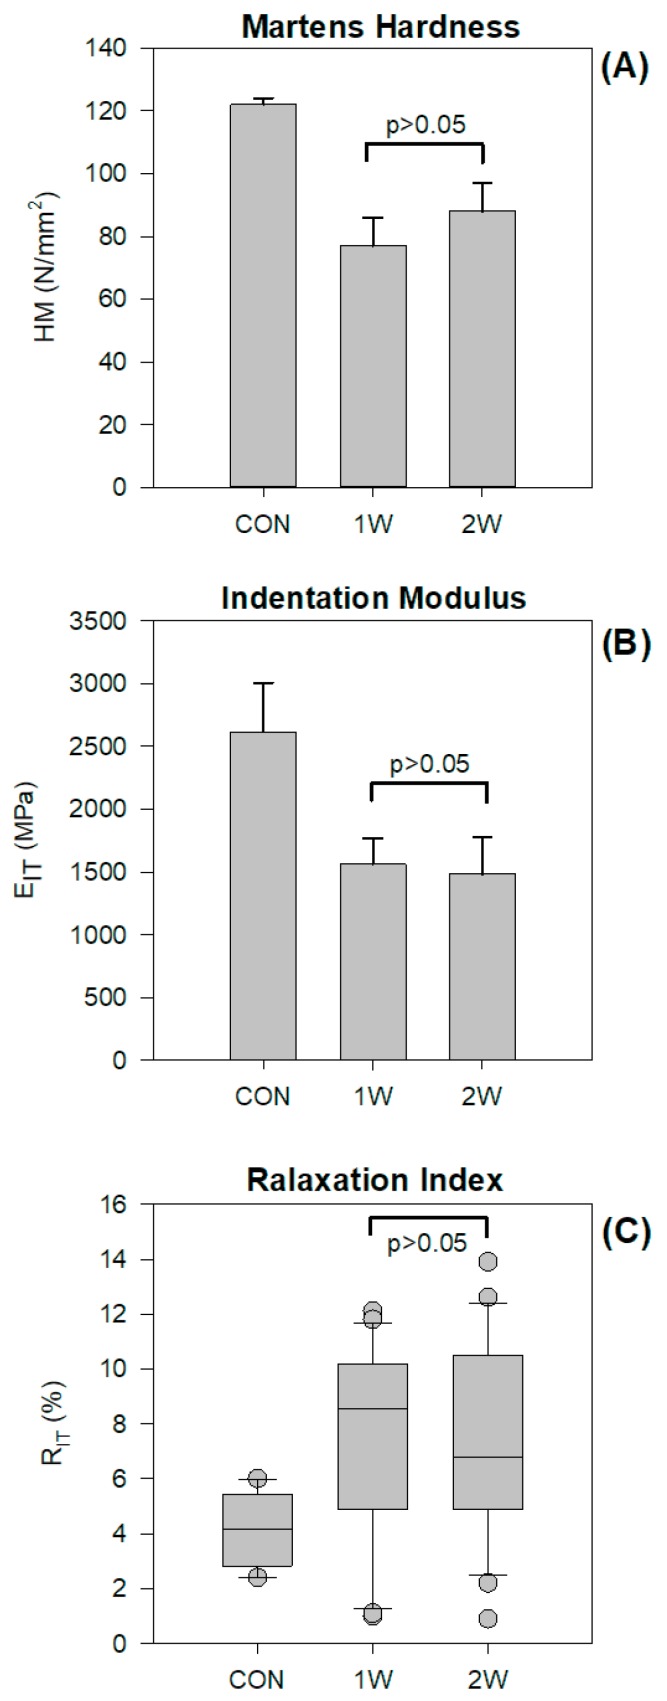
Figure 4.
Mean values and standard deviations of the Martens hardness (A) and indentation modulus (B) of groups tested. Medians, 25% and 75% percentiles, and outliers (demonstrated as circular points) for the relaxation index (C). Horizontal lines connect the mean values without statistically significant differences.

