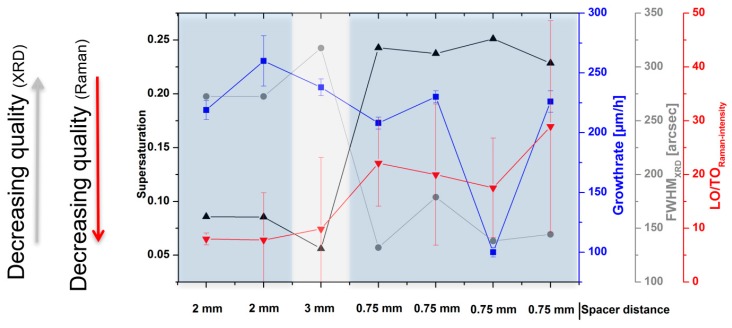
Figure 3.
Calculated supersaturation for SiC2 gas species for different experiments. Additional information is provided by growth rate (blue) and spacer distance. Analysis data (gray) is extracted from XRD measurements of the 002 peak and the FWHM. Raman data shows the intensity ratio of the LO and the TO mode (red).

