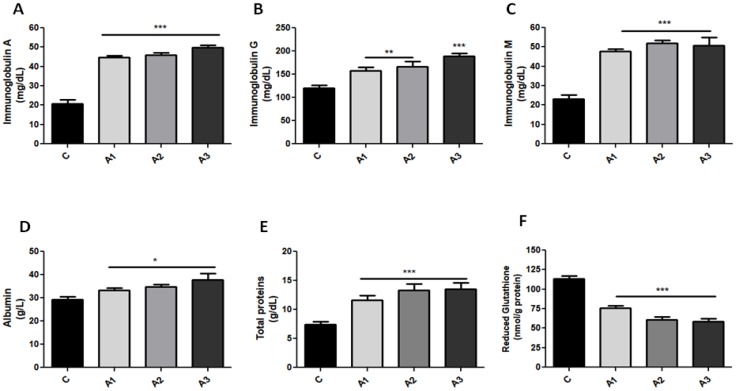
Figure 2.
Comparisons of IgA (A), IgG (B), IgM (C), albumin (D), total proteins (E), and reduced glutathione (F) in serum of the control and allicin-treated animals. Allicin treatment induced a prominent increase in immunoglobulins as compared to the control group. Allicin in a dose of 5 mg/kg induced IgG values twice as high as in the control group, whereas albumin and total proteins were also increased. Glutathione pool was decreased after allicin administration. Values are expressed as mean ± SD (* p < 0.05; ** p < 0.01; *** p < 0.001).

