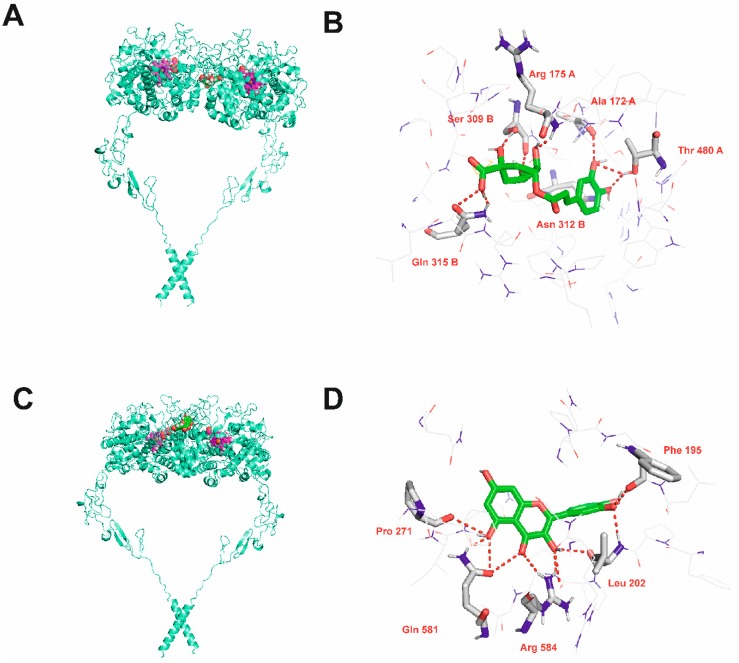
Figure 4.
Results of blind docking of chlorogenic acid (A,B) and quercetin (C,D) to TPO. Parts A and C show general position of the binding site. Protein shown in cartoon representation. Heme and inhibitors shown as spheres with magenta and green carbon atoms, respectively. Parts B and D show details of the binding site. Inhibitor molecules shown as sticks with green carbon atoms. Protein presented in wire representation with grey carbon atoms. Most important residues shown as sticks. Hydrogen bonds depicted as red dashed lines. Non-polar hydrogen atoms omitted for clarity.

