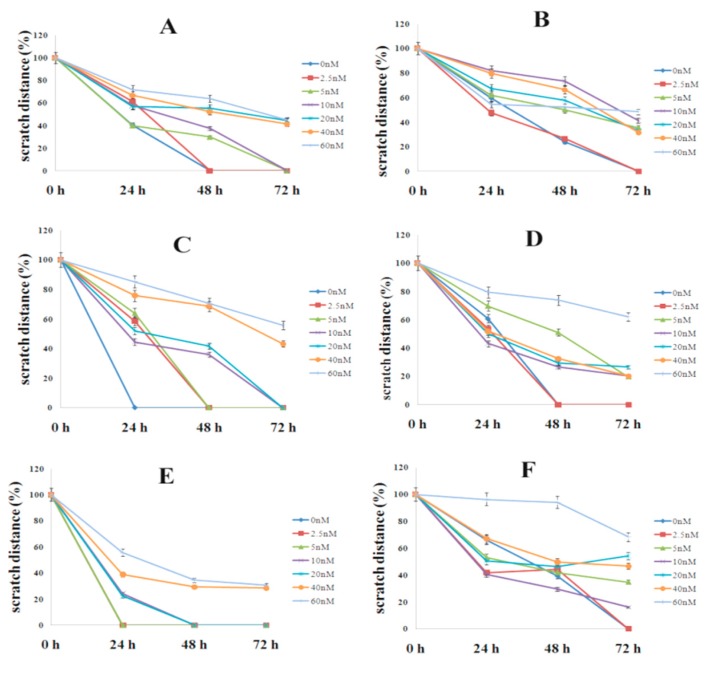
Figure 6.
Antiproliferative effect of colchicine on cell migration. Cells were treated with varying doses of colchicine (2.5–60 nM) and the distance they moved was measured using a scratch assay at different time-points (0, 24, 48, and 72 h). Each line is labeled with the drug concentrations used in the experiment. (A) A549, (B) HCT116, (C) SiHa, (D) PANC-1, (E) MDA-MB231, and (F) MCF-7.

