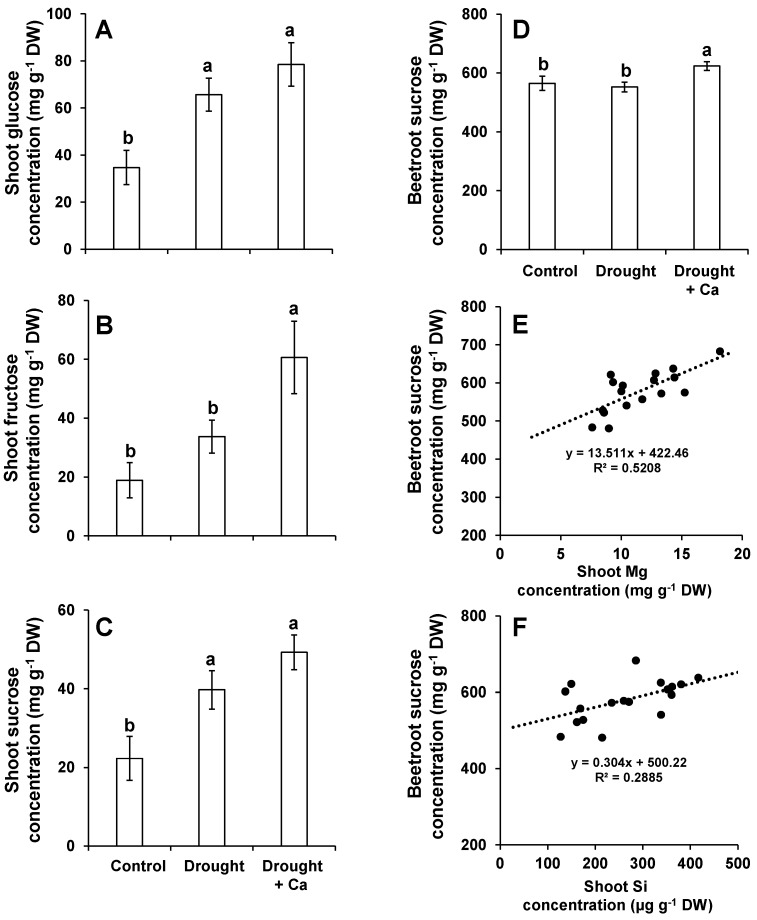
Figure 3.
Influence of foliar application of Ca2+ on soluble sugar concentration in sugar beet exposed to drought stress. (A) Shoot glucose concentration; (B) shoot fructose concentration; (C) shoot sucrose concentration; (D) beetroot sucrose concentration; (E) correlation between beetroot sucrose content and shoot Mg content; and (F) correlation between beetroot sucrose content and shoot Si content. Plants were grown in pots for a duration of 8 weeks. Five-week-old sugar beet plants were kept at 90% field capacity as control or exposed to drought stress (30% field capacity) for a duration of 3 weeks. Ca2+ was applied at BBCH14 and BBCH18 in concentration of 5 L ha−1 corresponding to 540 g Ca ha−1. Leaves and beetroot were harvested at 60 days after sowing for soluble sugars analysis. Bars indicate means ± SEM. Different letters denote significant differences according to ANOVA followed by SNK test (p < 0.05; n = 6).

