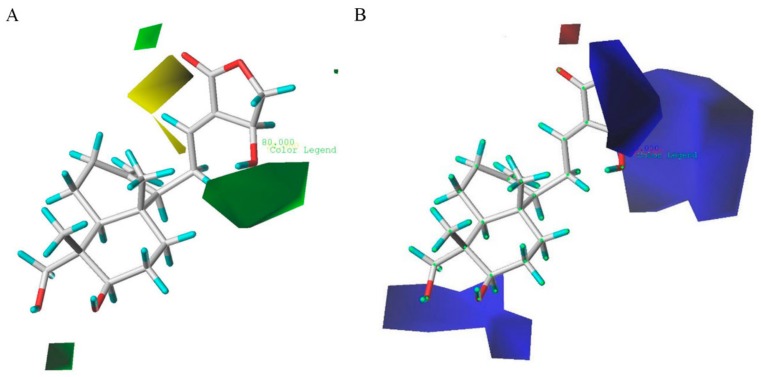
Figure 6.
CoMFA Std*Coeff contour maps in combination with compound AP-6 in group 2. (A) Steric field: green and yellow contours indicate regions where bulky groups enhance or reduce the activity, respectively. (B) Electrostatic field: blue and red contours indicate regions where electron-donating and electron-withdrawing groups enhance the potency, respectively.

