Figure 2.
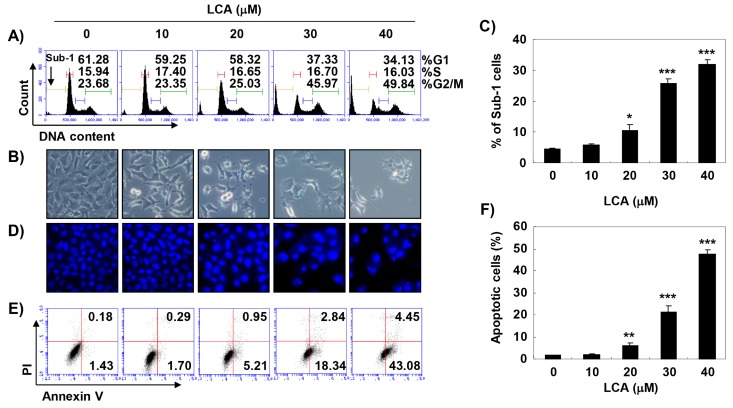
Induction of G2/M arrest and apoptosis by LCA in T24 cells. T24 cells were treated with various concentrations of LCA for 48 h. (A,C) Cells were stained with propidium iodide (PI) solution for flow cytometry analysis. (A) Quantification of the cell population (in percent) in different cell cycle phases of viable cells is shown. (C) Sub-G1% was calculated as the percentage of the number of cells in the sub-G1 population relative to the number of total cells. Data were expressed as the mean ± SD of three independent experiments (* p < 0.05 and *** p < 0.0001 compared to control). (B) Morphological changes of T24 cells were observed by phase-contrast microscopy. (D) The 4′,6-diamidino-2-phenylindole (DAPI) staining was performed to observe nuclear morphological alterations under an inverted phase-contrast microscope. Representative photographs of the morphological changes are presented. (E,F) To identify LCA-induced apoptosis, flow cytometry analysis was performed by Annexin V and PI staining. The percentage of annexin V+/PI+ cells in the top and annexin V+/PI− cells in the bottom right quadrant are indicated. Each point represents the mean of three independent experiments. (E) Representative profiles. (F) The percentages of apoptotic cells were determined by expressing the numbers of Annexin V+ cells as percentages of all cells. Each data point represents the mean ± SD of three independent experiments (** p < 0.001 and *** p < 0.0001 compared to control).

