Figure 7.
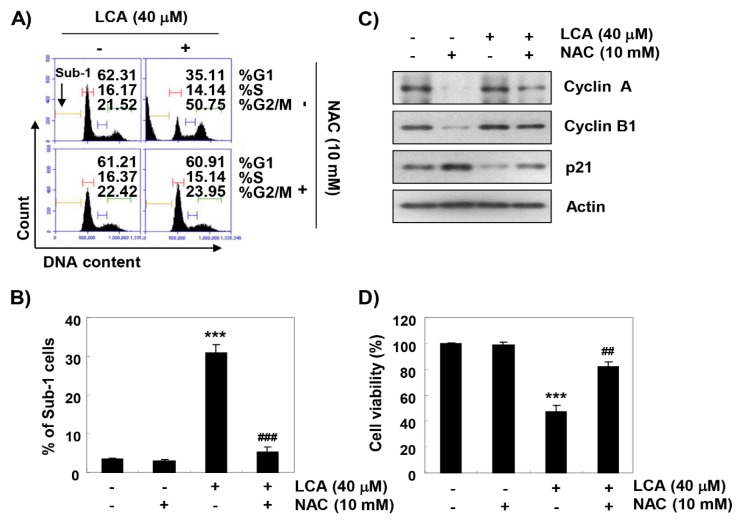
Roles of ROS on LCA-induced cell cycle arrest and apoptosis in T24 cells. The cells were either treated with 40 μM LCA for 48 h or pre-treated with 10 mM NAC for 1 h before 40 μM LCA treatment and then collected. (A,B) Cells were stained with PI solution for flow cytometry analysis. (A) Representative profiles. Quantification of the cell population (in percent) in different cell cycle phases of viable cells is shown. (B) The percentages of apoptotic sub-G1 were calculated as the percentage of the number of cells in the sub-G1 population, relative to the number of total cells. (C) Expression of cyclin A, cyclin B1, and p21 protein was evaluated by Western blot analysis. (D) The cell viability was determined by MTT assay. Each bar represents the mean ± SD of three independent experiments (*** p < 0.0001 compared to control; ## p < 0.001 compared to LCA-treated cells; ### p < 0.0001 compared to LCA-treated cells).

