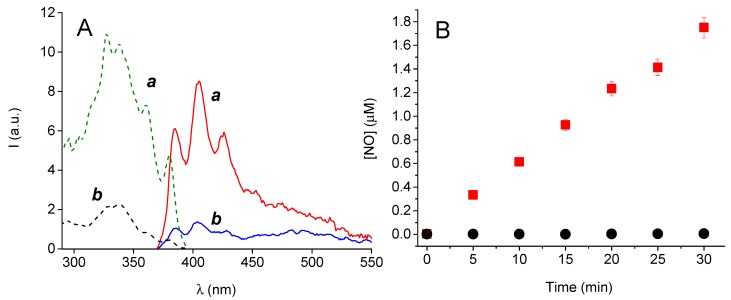
Figure 3.
(A) Representative fluorescence emission (solid, λexc = 360 nm) and excitation (dotted, λem = 405 nm) spectra obtained after fluorimetric assay of CL loaded with 1, immersed in 3 mL of artificial tears solution, and exposed to daylight (a) or kept in the dark (b). (B) NO concentration, determined by the fluorimetric assay, observed after exposure of the CL loaded with 1 to daylight for different times (■) or kept in the dark (●).

