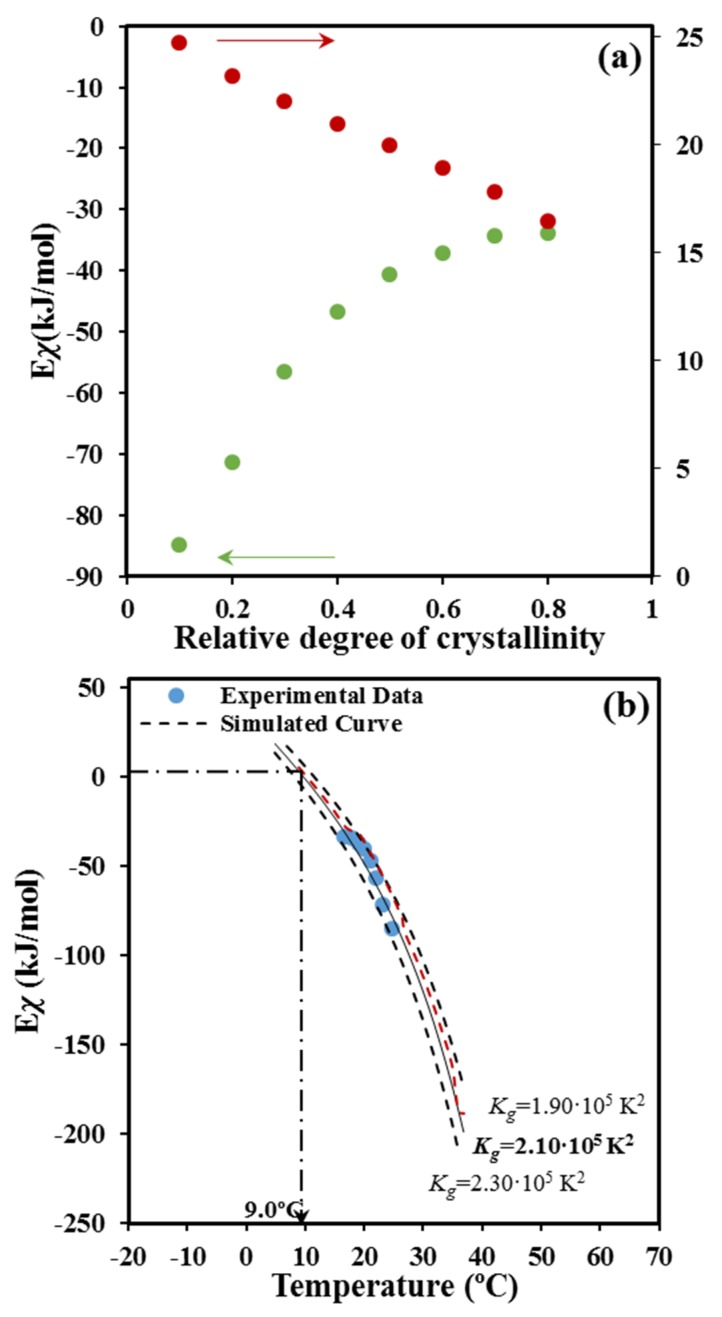
Figure 9.
(a) Dependence of the activation energy of crystallization (●) and the average crystallization temperature (●) on crystallinity. (b) Experimental Ex vs. T data for non-isothermal crystallization of P4HB. The solid black line corresponds to the data calculated by Equation (11) and the optimized crystallization parameters. Arrow indicates the expected temperature for the maximum crystallization rate (i.e., the effective activation energy becomes equal to zero).

