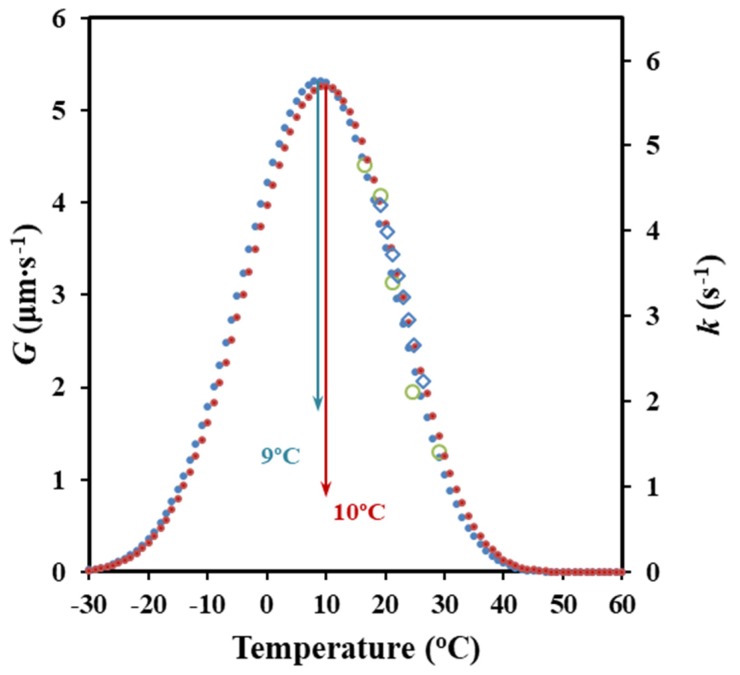
Figure 10.
Comparison between bell-shaped curves of G/k temperature dependence obtained from DSC data and the two non-isothermal methodologies (from Avrami analysis (●) and activation energy (●) with their respective experimental results (o) (◊). An arbitrary value of G0 has been selected to fit the maximum rate of both curves.

