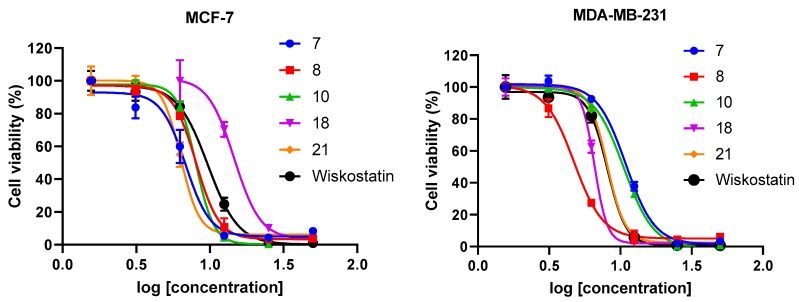
Figure 2.
Log-dose response curve for compounds 7, 8, 10, 18, 21, and Wiskostatin on MCF-7 and MDA-MB-231 breast cancer cell lines. Each data point represents the mean of three replicates and error bars represent ± SD. Each GI50 value was calculated based on sigmoidal curve fitting to the respective data set.

