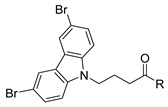
Table 1.
Cell growth inhibition and anti-migration activity of 3,6-dibromocarbazole derivatives.
| Comp. |
 R = |
GI50 (µM)a | Migration (%)b,c | |
|---|---|---|---|---|
| MCF-7 | MDA-MB-231 | |||
| 4 |

|
>50 | >50 | 99 ± 6.03 |
| 5 |

|
>50 | >50 | 99 ± 5.98 |
| 6 |

|
16.8 | 16 | 94 ± 3.93 |
| 7 |

|
6.8 | 10 | 99 ± 0.03 (at 2 μM) |
| 8 |

|
8 | 4.7 | 97 ± 4.90 (at 1 μM) |
| 9 |

|
13.4 | 15.4 | 99 ± 1.58 (at 3.1 μM) |
| 10 |

|
8.1 | 10.5 | 87 ± 4.65 (at 2.1 μM) |
| 11 |

|
>50 | >50 | 99 ± 0.02 |
| 12 |

|
>50 | >50 | 97 ± 6.41 |
| 13 |

|
>50 | 25 | 99 ± 0.03 |
| 14 |

|
11.8 | 16.7 | 81 ± 8.96 |
| 15 |

|
>50 | >50 | 80 ± 5.87 |
| 16 |

|
18.2 | 23 | 82 ± 7.52 |
| 17 |

|
17.5 | >50 | 99 ± 2.09 |
| 18 |

|
7.5 | 6.7 | 99 ± 0.02 |
| 19 |

|
12.4 | >50 | 99 ± 0.97 |
| 20 |

|
9.1 | 13.4 | 99 ± 0.05 (at 2.7 μM) |
| 21 |

|
6.5 | 8 | 99 ± 0.48 (at 1.6 μM) |
| 22 |

|
>50 | >50 | 97 ± 4.19 |
| 23 |

|
>50 | 19 | 90 ± 6.60 |
| 24 |

|
32.2 | >50 | 82 ± 5.19 |
| 25 |

|
>50 | >50 | 96 ± 4.69 |
| 26 |

|
>50 | >50 | 99 ± 6.52 |
| 27 |

|
>50 | >50 | 99 ± 0.05 |
| Wiskostatin | 9.7 | 8.3 | 95 ± 6.79 (at 2 μM) |
|
a GI50 = compound concentration required to inhibit MDA-MB-231 proliferation by 50% after 48 h treatment. Values are expressed as the mean of triplicate experiments, and standard deviation (SD) is <10%. b After 24 h, MDA-MB-231 cellular migration was determined by measuring the distance traveled from the edge of the scratch toward the center of the scratch, relative to control. c Percent relative migration values at 10 µM (or at concentrations that do not affect cell viability). Results are presented as means ± SD of three independent experiments.
