Figure 4.
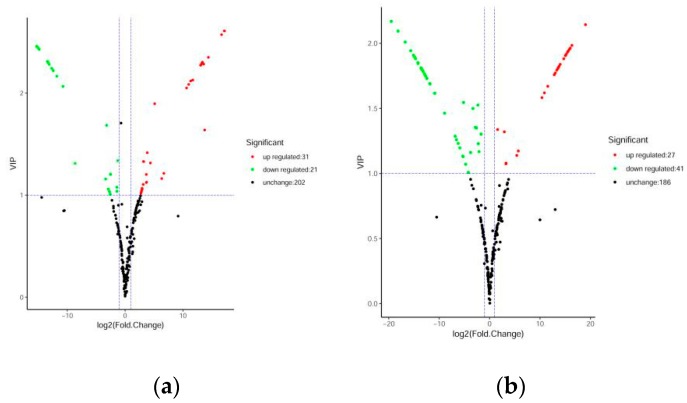
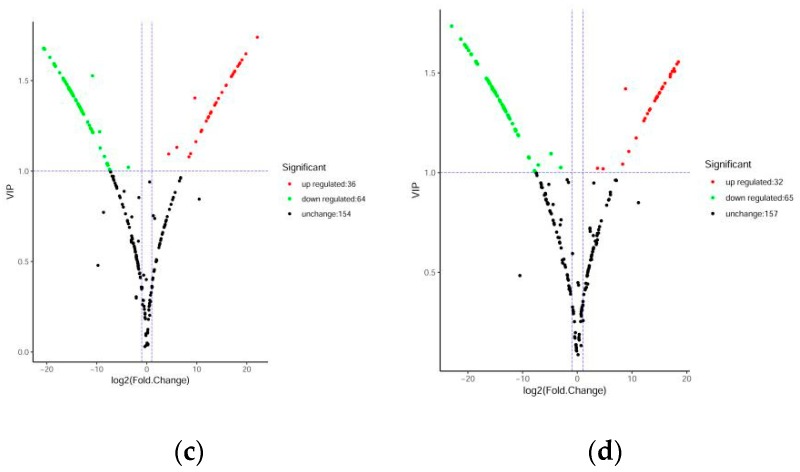
Volcanic plots of differential metabolites. (a) DHP versus BZH; (b) DHP versus TC; (c) DHP versus HZY; (d) DHP versus YCC. Each point in the volcanic plot represents a metabolite, the abscissa represents the logarithm of the quantitative difference multiples of a metabolite in two samples, and the ordinate represents the variable importance in project (VIP) value. The larger the abscissa absolute value is, the more significant the differential expression is, and the more reliable the screened differential expression metabolites are. The green dots in the figure represent down-regulated differentially expressed metabolites, the red dots represent up-regulated differentially expressed metabolites, and the black dots represent metabolites detected but that are not significantly different.


