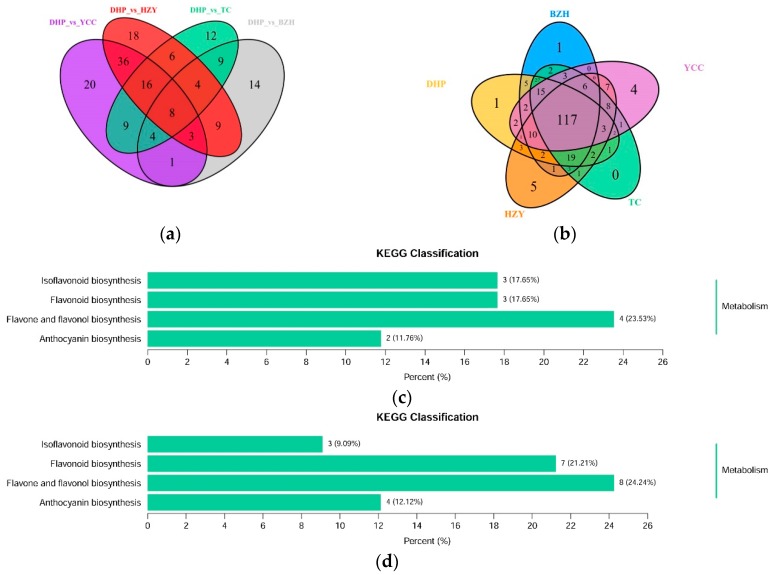
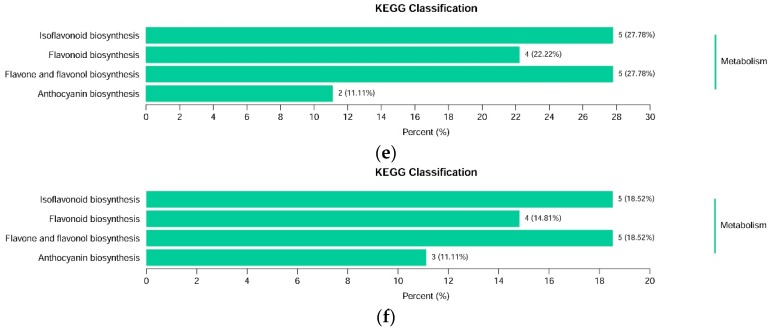
Figure 5.
Venn diagram of differential flavonoid metabolites for each comparison group and Kyoto Encyclopedia of Genes and Genomes (KEGG) classification results. (a) Venn diagram shows the overlapping and unique differential metabolites amongst the comparison groups; (b) Venn diagram shows the overlapping and unique metabolites amongst the comparison groups; (c)–(f) The differential metabolites KEGG classification of the comparison group DHP versus BZH, DHP versus HZY, DHP versus TC, and DHP versus YCC, respectively.


