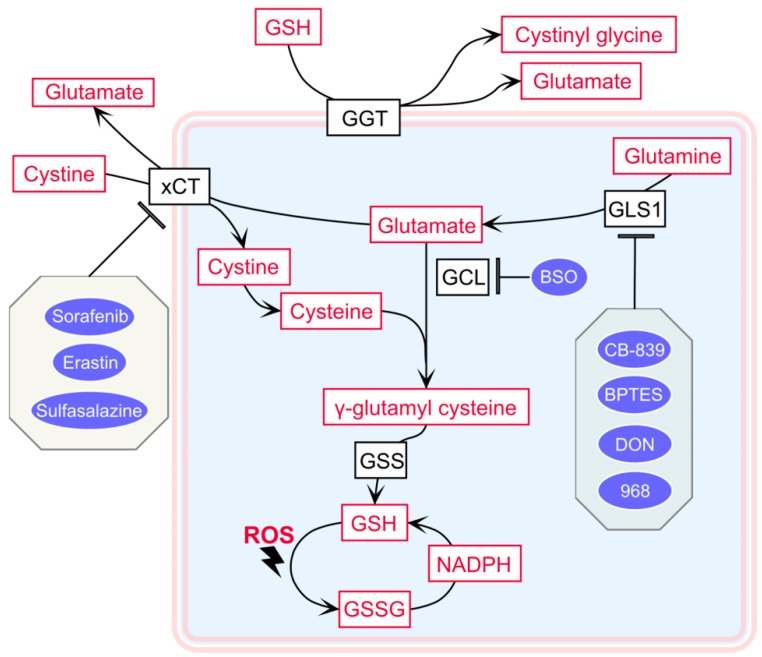
Figure 1.
Schematic overview of glutathione (GSH) metabolism and the targeting sites of inhibitors. Color codes are defined as follows: black = enzymes or transporters; red = metabolites; blue = inhibitors. GGT: γ-glutamyl transferase; xCT: solute carrier family 7 member 11, a cystine-glutamate antiporter; GLS1: glutaminase 1; GCL: glutamate cysteine ligase; GSS: glutathione synthetase. GSSG: glutathione oxidized form; ROS: reactive oxygen species.

