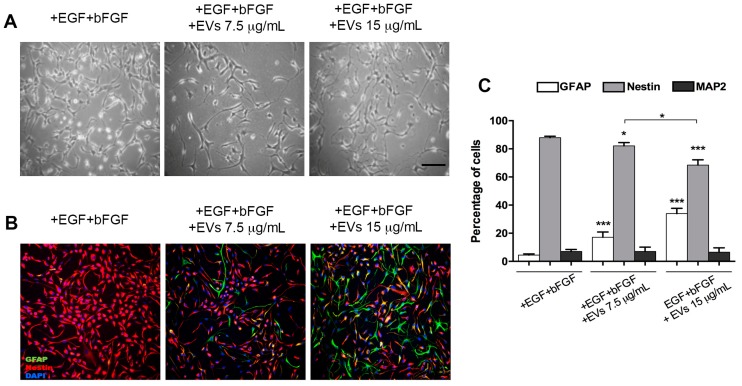
Figure 3.
NSPCs maintained in medium containing +EGF+bFGF and treated or untreated with 5% FBS EVs at 7.5 and 15 μg/mL. (A) Bright-field images of cultures; (B) immunofluorescence labelling with anti-GFAP (green) and anti-nestin (red) antibodies and DAPI (blue); (C) quantification of GFAP-, nestin- and MAP2-positive cells after three-day treatment with 5% FBS EVs (7.5 and 15 μg/mL) compared to untreated controls (+EGF+bFGF). Scale bar: 100 μm (images in A and B have the same magnification). Values are mean of at least three independent experiments. * p < 0.05; *** p < 0.0001.

